How to map customer journeys to deliver personalised experiences
In our fifth article in our Catapult series on omnichannel personalisation, we look at mapping customer journeys to deliver personalised content to your audience segments.

Future thinking organisations do not see personalisation as a series of disconnected moments, but rather as a continuous lifetime journey. Therefore, with some solid audience segments in place, the next challenge is for you to map out their typical journeys. By doing this you will be far better positioned to deliver an exceptional personalised experience for them with tailored content to meet their specific needs.
What is a customer journey map?
If you have been working in marketing or sales for a while, you should be familiar with the details of a customer journey map. For those of you who are less familiar or are wondering if what you had in mind will be suitable for these purposes, we dive into it a bit more here.
In its most basic form, customer journey mapping starts by compiling a series of user goals and actions into a timeline skeleton. Next, the skeleton is fleshed out with customer thoughts and emotions in order to create a narrative. Finally, that narrative is condensed into a visualization used to communicate insights that will inform your planning. There are many different templates you could use to create your customer journey maps. Every map is different, but nearly all of them will have certain key elements in common. These items have commonly known names and definitions. We are not specifically advocating one over the other but chose one that we believe has solid grounding. This short 2-minute video with Sarah Gibbons from Nielsen Norman Group, discusses their definition of a Customer Journey Map.
Deconstructing a Customer Journey map
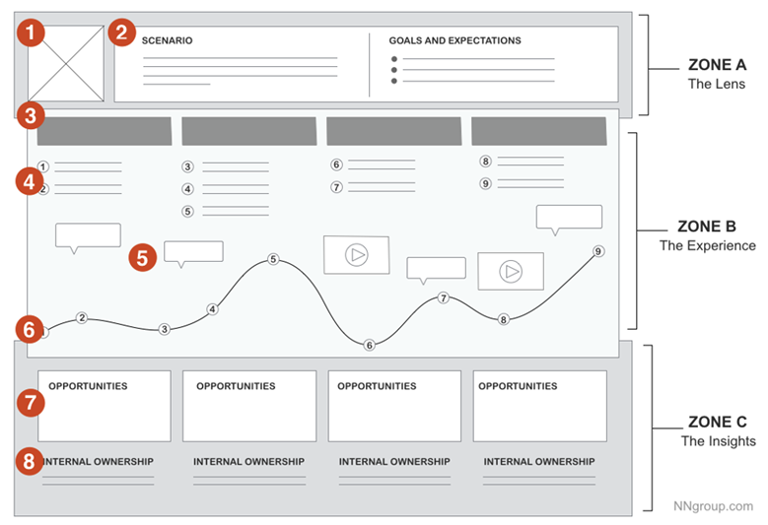
While journey maps vary based on the specific context for which they are used, they tend to follow a general model that includes zones for the ‘lens’, the mapped experience, and the insights learned throughout the process. See the below diagram for more detail with annotations below.

Zone A: The lens provides constraints for the map by assigning (1) a persona (“who”) and (2) the scenario to be examined (“what”).
Zone B: The heart of the map is the visualized experience, usually aligned across (3) chunkable phases of the journey. The (4) actions, (5) thoughts, and (6) emotional experience of the user has throughout the journey can be supplemented with quotes or videos from research.
Zone C: The output should vary based on the business goal the map supports, but it could describe the insights and pain points discovered, and the (7) opportunities to focus on going forward, as well as (8) internal ownership.
As your content should be segmented towards audience segments, but also by customer journey stages, we recommend mapping out customer journeys for each major channel, and figure out how those journeys overlap, so personalisation can continue when the end-user switches from one device or channel to another.
Analysing your customer behaviour
Taking the time to analyse the behaviour of consumers on your website or app is incredibly useful when adding data to your customer journey mapping. This type of data could include transaction or purchase frequency and recency, actions that are taken on your site, results from UX testing and even surveys. This evidence-based data will complement the more empathetic attributes that shape your Personas and add another level of detail to the customer journeys you map out.


